Best Time to Visit Belize: Rainfall, Rain Days and Storm Months, From Belize's Own Records
Verified on 24 September 2026 (first researched 26 August 2026), against the Belize National Meteorological Service’s own 1991–2020 climatology tables and its historical-storms list, plus NOAA’s Atlantic hurricane climatology and its updated 2026 season outlook.
If you want one window: the driest month of the year falls in either March or April at all eight weather stations whose 1991–2020 normals Belize’s met service publishes, and of the 64 dated records in the National Meteorological Service’s 68-record storm list — which runs from 1864 to 2022 — every one falls between May and November. (Four rows in that list carry a year but no month; they are named further down.) At Philip Goldson International Airport, March and April average 4 rain-days a month (days with more than 1 mm of rain, the met service’s threshold); September and October average 16.
The month you pick changes the rain, not the heat. At the airport the mean daily temperature moves only from 24.3 °C in January to 28.7 °C in June — a 4.4 °C swing across the whole year. Where the month matters enormously is water: Belize’s wettest station receives nearly three times the annual rainfall of its driest. The met service publishes no station on Caye Caulker or Ambergris Caye, so the airport figures below are the nearest record to either.
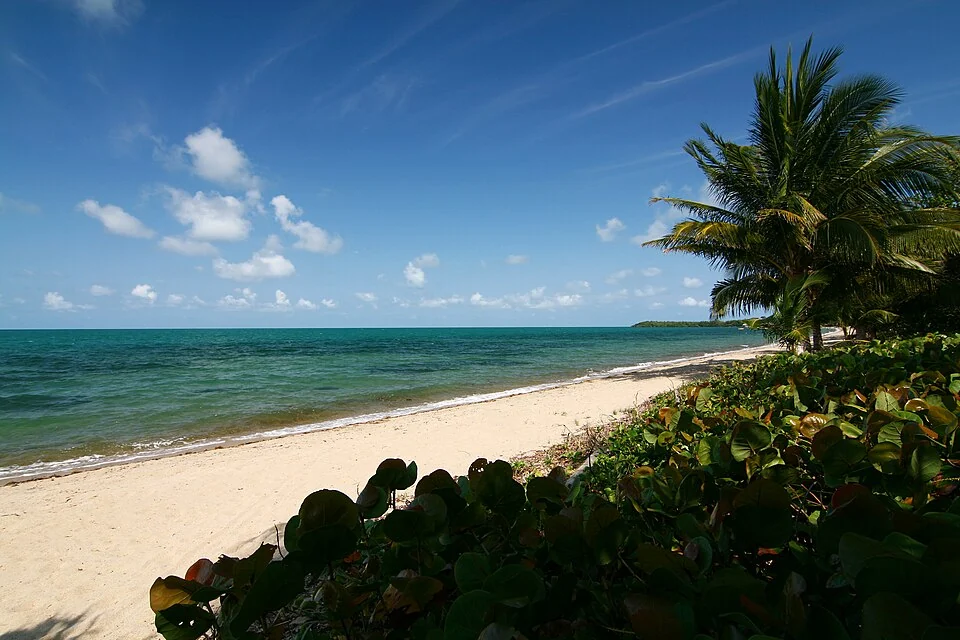
Belize by month, at Belize’s international airport
Philip Goldson International Airport, Ladyville — 1991–2020 normals, 30 years of record. Storm columns are counts of records in the National Meteorological Service’s historical-storms list for the whole country.
| Month | Rainfall (mm) | Days with >1 mm rain | Mean daily temp | Avg daily max | Storm records, all dated (n=64) | Storm records, 1950–2022 (n=30) |
|---|---|---|---|---|---|---|
| January | 141.4 | 10 | 24.3 °C (75.7 °F) | 27.9 °C | 0 | 0 |
| February | 64.7 | 6 | 25.2 °C (77.4 °F) | 28.8 °C | 0 | 0 |
| March | 41.0 | 4 | 26.1 °C (79.0 °F) | 29.8 °C | 0 | 0 |
| April | 58.0 | 4 | 27.7 °C (81.9 °F) | 31.2 °C | 0 | 0 |
| May | 131.8 | 7 | 28.5 °C (83.3 °F) | 31.9 °C | 1 | 1 |
| June | 236.4 | 12 | 28.7 °C (83.7 °F) | 31.7 °C | 6 | 1 |
| July | 180.2 | 14 | 28.4 °C (83.1 °F) | 31.5 °C | 4 | 2 |
| August | 195.0 | 14 | 28.5 °C (83.3 °F) | 31.8 °C | 12 | 6 |
| September | 229.8 | 16 | 28.3 °C (82.9 °F) | 31.8 °C | 20 | 9 |
| October | 305.5 | 16 | 27.2 °C (81.0 °F) | 30.6 °C | 18 | 10 |
| November | 235.8 | 13 | 25.6 °C (78.1 °F) | 29.2 °C | 3 | 1 |
| December | 150.9 | 12 | 24.7 °C (76.5 °F) | 28.3 °C | 0 | 0 |
| Year | 1,970.5 mm / 77.6 in | 128 | 24.3–28.7 °C | 27.9–31.9 °C | 64 | 30 |
Rainfall, rain-days and temperatures are the met service’s published normals for this station; the Fahrenheit figures are our conversion of its Celsius values. October is the wettest month at the airport — 305.5 mm across 16 rain-days, rain on roughly one day in two.
⚠️ A trap in the source. The met service’s climatology tables carry an “Annual” column, and it is not an annual total — it holds the mean of the twelve monthly values. The airport’s table prints 164.2, which is 1,970.5 ÷ 12. Anyone quoting that column as a year’s rainfall is wrong by a factor of twelve. Every annual total on this page is our own sum of the twelve published monthly normals, and is labelled as such.
Belize is not one climate — it is at least two
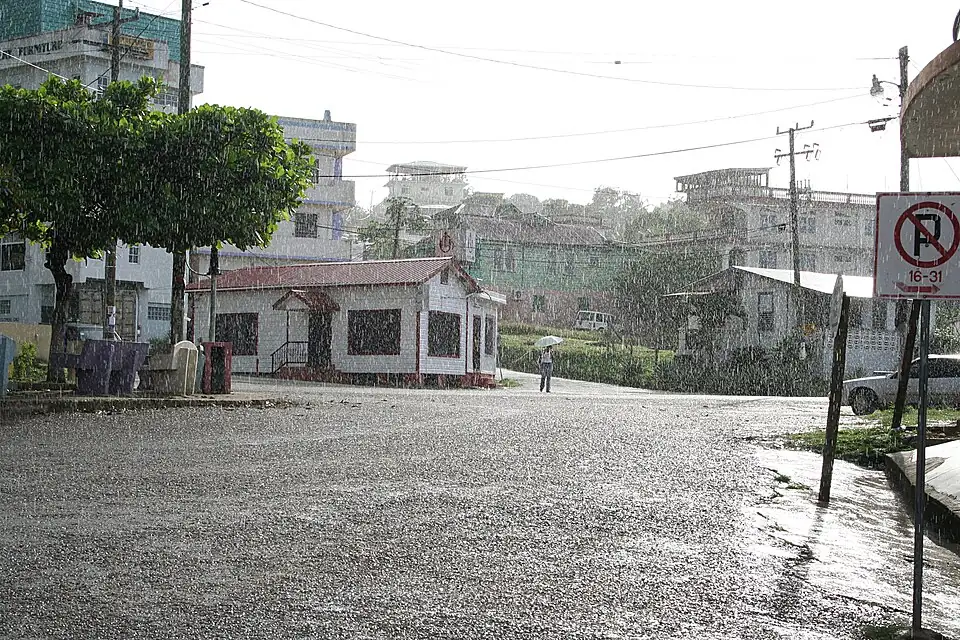
Annual totals, summed by us from the met service’s published monthly normals, 1991–2020:
| Station | District | Annual rainfall | Driest month | Wettest month |
|---|---|---|---|---|
| Libertad | Corozal (north) | 1,330.4 mm / 52.4 in | March, 28.6 mm | October, 203.1 mm |
| BSI Tower Hill | Orange Walk (north) | 1,393.7 mm / 54.9 in | March, 25.0 mm | October, 205.2 mm |
| Central Farm | Cayo — nearest station to San Ignacio | 1,557.5 mm / 61.3 in | April, 35.2 mm | October, 209.3 mm |
| Belmopan (BAHA) | Cayo | 1,929.8 mm / 76.0 in | April, 41.4 mm | June, 259.9 mm |
| Philip Goldson International | Belize (coast) | 1,970.5 mm / 77.6 in | March, 41.0 mm | October, 305.5 mm |
| Melinda Forest Station | Stann Creek — nearest to Hopkins/Dangriga | 2,112.0 mm / 83.1 in | April, 53.5 mm | October, 301.1 mm |
| Savannah Forest Station | Stann Creek | 2,371.8 mm / 93.4 in | April, 48.6 mm | September, 353.3 mm |
| Punta Gorda | Toledo (far south) | 3,745.8 mm / 147.5 in | March, 73.4 mm | July, 709.8 mm |
Punta Gorda receives 2.8 times the annual rainfall of Libertad. In July alone it records 709.8 mm — more than half of everything Libertad receives in a year — across 22 rain-days. That is why a single national “best time to visit Belize” answer does not survive contact with the data: July in Toledo and July at the airport are not the same month.
Two patterns do hold everywhere. The driest month at every one of the eight stations falls in either March or April — March at Libertad, Tower Hill and the airport in the north and on the coast, and at Punta Gorda in the far south; April at Belmopan, Central Farm, Savannah and Melinda. So the two months split the country four stations each. The met service’s own prose summary elsewhere on its site names a single answer — dry season “from November to May with April as the driest month” — which its station tables above do not support at four of the eight. We are not reconciling the body with itself; we are telling you the tables split March–April four each, and that the summary says April. And October is the wettest month at five of the eight; the exceptions are Belmopan (June), Savannah (September) and Punta Gorda (July).
The met service publishes no station on Ambergris Caye or Caye Caulker, and none in San Ignacio town or Placencia. Where this page names a proxy — Central Farm for San Ignacio, Melinda for Hopkins and Dangriga, Philip Goldson for the coast — that is the met service’s nearest station, not the place itself.
Hurricane season, in counts rather than adjectives
The Atlantic hurricane season that governs Belize runs 1 June to 30 November (NOAA). NOAA puts the statistical peak at 10 September, “with most activity occurring between mid-August and mid-October”, and gives basin-wide 1991–2020 averages of 14 named storms, 7 hurricanes and 3 major hurricanes a season, with the first named storm typically around 20 June, the first hurricane around 11 August and the first major hurricane around 1 September. Those are Atlantic-basin numbers, not Belize numbers.
For 2026, NOAA’s updated Atlantic outlook, issued 6 August 2026, gives a 75% chance of a below-normal season, 20% near-normal and 5% above-normal, with 70%-probability ranges of 7–13 named storms, 2–6 hurricanes and 0–2 major hurricanes. NOAA states that the outlook “is not a seasonal hurricane landfall forecast, and it does not predict levels of activity for any particular location” — so it says nothing specific about Belize.
For Belize specifically, the met service publishes a table of 68 storms from 1864 to 2022 that have affected the country. We counted it. Four rows — NANA (2020), ETA (2020), IOTA (2020) and LISA (2022) — give only a year, so the month tallies below cover the 64 dated records.
| Month | Storm records | Share of the 64 dated records |
|---|---|---|
| September | 20 | 31.2% |
| October | 18 | 28.1% |
| August | 12 | 18.8% |
| June | 6 | 9.4% |
| July | 4 | 6.2% |
| November | 3 | 4.7% |
| May | 1 | 1.6% |
| December–April | 0 | 0% |
These are historical shares, not probabilities. Neither NOAA nor the Belize met service publishes a Belize-specific monthly strike probability or return period, and a share of past records is not a chance of a storm during your trip. What the counts do say is where the record is concentrated: 59.4% of Belize’s dated storm records fall in September–October, and 78.1% in August–October.
That is not an artefact of nineteenth-century records either. Restricted to 1950–2022 — 30 dated records — the split is October 10, September 9, August 6, July 2, and one each in May, June and November: 83% in August–October.
Most storms that reached Belize did not make landfall
The met service publishes a nearest-approach distance for each storm, which is unusual. Of the 68 listed, cumulatively: 31 made landfall, 38 came within 30 miles, 46 within 60 miles, and 63 within 100 miles.
On intensity, more than half the record is not hurricanes at all: 35 tropical storms and 1 tropical depression, against 16 Category 1, 8 Category 2, 2 Category 3, 3 Category 4 and 3 Category 5 — 36 of the 68 records below hurricane strength.
How often Belize actually takes a landfall — two answers
| Period | Landfall records | Rate |
|---|---|---|
| 1864–2022 (159 years) | 31 | One roughly every 5.1 years |
| 1950–2022 (73 years) | 7 | One roughly every 10.4 years |
Both are our arithmetic on the met service’s own list, and we are printing both rather than one clean number, because the gap between them is suspicious: 24 of the 31 landfall records predate 1950, four of them in 1931 alone. That is more likely a change in how older events were classified than a real halving of risk. Treat both figures as period figures rather than as the rate for a given year.
Every major hurricane on Belize’s record came in August, September or October
All eight Category 3+ records, with the met service’s nearest-approach distance:
| Storm | Month and year | Category | Nearest approach |
|---|---|---|---|
| (unnamed) | September 1931 | H3 | Made landfall |
| JANET | September 1955 | H5 | 60 mi |
| HATTIE | October 1961 | H4 | Made landfall |
| CARMEN | September 1974 | H4 | 68 mi |
| MITCH | October 1998 | H5 | *150 mi |
| KEITH | October 2000 | H3 | 35 mi |
| IRIS | October 2001 | H4 | Made landfall |
| DEAN | August 2007 | H5 | 85 mi |
Four of the eight are October, three September and one August. The filtering here is ours; the records are the met service’s.
What this adds up to
March and April are where the two datasets agree — the driest month of the year falls in one or the other at all eight stations, and neither month holds a single dated storm record across 159 years. May is a different case, and the data splits: the storm record stays nearly empty (one record in 159 years), but rainfall more than doubles from April to May at every one of the eight stations, from 2.3× at the airport to 3.0× at Tower Hill. A dry-season trip and a storm-free trip are not quite the same trip.
At the other end of the calendar the two peaks stack: the wettest month (October at five of eight stations) and the storm-record peak (September–October, 59.4% of dated records) land in the same eight-week stretch.
All of that is record rather than forecast. It is what Belize’s own 30-year normals and 159-year storm list contain.
What the operators don’t publish
These are gaps in what the meteorological authorities publish, not ours:
- A per-month probability of a hurricane strike on Belize. Neither NOAA’s National Hurricane Center nor the Belize met service publishes a Belize-specific monthly strike probability or return period. Every month figure on this page is a count we tabulated.
- A Belize-specific 2026 forecast. NOAA’s 2026 outlook covers the whole Atlantic basin and, in NOAA’s words, does not predict activity for any particular location.
- Official wet-season / dry-season month boundaries on the met service’s climatology page. That page carries no seasonal boundary statement — the “November to May” wording quoted above is on its separate climate-summary page — so the dry-window conclusions above are derived from the climatology rainfall table and labelled as ours.
- Sea temperature by month, from the met service.
- Any weather station on Ambergris Caye, Caye Caulker, in San Ignacio town, or at Placencia. The nearest station to the cayes is Philip Goldson International Airport, on the mainland coast.
- Storm records after 2022. The met service’s historical-storms list ends with LISA (2022).
How we researched this
Scope: this page reports source research, not an on-site test. We checked the booking systems, timetables and official sources named below on the date shown; calculations, unresolved disagreements and information we could not verify are labelled explicitly.
On 26 August 2026 we transcribed the Belize National Meteorological Service’s 1991–2020 climatology tables for eight stations directly from the raw HTML — monthly rainfall in mm, the “NUM Rain Days > 1mm” row, and mean, maximum and minimum temperatures — rather than from a rendering of them. On 24 September 2026 we re-read the same tables and the storm list at source: every published value was unchanged. Every annual total on this page is our own sum of twelve published monthly values, because the source’s own “Annual” column is a monthly mean. That relationship reproduces exactly at six of the eight stations. Two do not quite land: Central Farm prints 130.1 against our 129.8, and Punta Gorda prints 314.7 against our 312.2 — near-misses consistent with different months carrying different record lengths, and far too small to make the column an annual total.
The storm tables are our tabulation of the met service’s own 68-row historical-storms list: the month counts, era splits, landfall counts, nearest-approach bands, intensity mix and the Category 3+ filter are all ours, applied to its records. Four undated rows are excluded from month tallies and named above. The Atlantic season dates, the 10 September peak, the basin-wide averages and the 2026 outlook are NOAA’s, quoted as basin figures.
Fahrenheit values are our conversion of the met service’s Celsius figures. Where the met service publishes no station for a place, we say which station is standing in for it.
Figures on this page labelled our arithmetic are calculated by us from the sourced inputs cited below — comparisons, percentages, multiples, differences, per-night and per-person conversions, running totals and currency conversions. Every other figure is reproduced as its named source published it. Where an operator or authority publishes a per-person or per-night rate directly, that is their figure and it is attributed to them at the point it appears.
Sources
- Belize National Meteorological Service — Climatology (1991–2020) — monthly rainfall, rain-days and temperature normals for all eight stations, and the “Annual” column whose definition this page corrects.
- Belize National Meteorological Service — Climate Summary — the prose dry-season summary, “from November to May with April as the driest month”, which its own station tables do not support at four of the eight.
- Belize National Meteorological Service — Historical Storms — the 68-record 1864–2022 storm list, with categories, dates and nearest-approach distances, from which every storm count here is tabulated.
- NOAA National Hurricane Center — Tropical Cyclone Climatology — the 1 June–30 November season, the 10 September peak, the mid-August to mid-October activity window, and the 14/7/3 basin averages with typical first-storm dates.
- NOAA Climate Prediction Center — 2026 Atlantic Hurricane Season Outlook (updated 6 August 2026) — the 75/20/5 season probabilities, the 7–13 / 2–6 / 0–2 activity ranges, and NOAA’s statement that the outlook is not a landfall forecast for any location.
Last verified: 2026-09-24. Climate normals are 1991–2020; the storm record ends in 2022.
Written by Estuardo Enriquez. This site is independent, carries no affiliate relationship with any operator named here, and is not connected to any previous owner of this domain.